ALL TOPICS
L
o
ve
To
Know
Life
Lifestyle
Relationships
Wellness
Aging
Astrology
Style
Work Life
Grief & Loss
Diversity & Inclusion
Parenting
Pregnancy
Baby
Toddlers
Kids
Teens
Parenthood
Adulting
Home
Antiques & Collectibles
Cleaning
Design & Decor
Garden
Projects & DIY
Sustainability
Food
& Drink
Recipes
Meal Ideas
Wine
Cocktails
Mocktails
Drinks & Beer
Ingredients & Supplies
Celebrations
Parties
Weddings
Christmas
Halloween
Thanksgiving
Special Occasions
Quotes
& Quips
Daily Life
Inspirational
Love
Relationships
Holiday
Special Occasions
Jokes
Poems
Captions
The Catalog
Stuff We Love
Gift It
Beauty & Style
Home & Kitchen
Kids & Pets
Pets
close
Life
Lifestyle
Relationships
Wellness
Aging
Astrology
Style
Work Life
Grief & Loss
Diversity & Inclusion
Parenting
Pregnancy
Baby
Toddlers
Kids
Teens
Parenthood
Adulting
Home
Antiques & Collectibles
Cleaning
Design & Decor
Garden
Projects & DIY
Sustainability
Food & Drink
Recipes
Meal Ideas
Wine
Cocktails
Mocktails
Drinks & Beer
Ingredients & Supplies
Celebrations
Parties
Weddings
Christmas
Halloween
Thanksgiving
Special Occasions
Quotes & Quips
Daily Life
Inspirational
Love
Relationships
Holiday
Special Occasions
Jokes
Poems
Captions
The Catalog
Stuff We Love
Gift It
Beauty & Style
Home & Kitchen
Kids & Pets
Pets
Privacy Policy
Terms of Service
Home
Sustainability
10 Plastic Bottle Crafts That Are Way More Fun Than Recycling
by Megan Cooper, M.A.S., B.S. History
10 Plastic Bottle Crafts That Are Way More Fun Than Recycling
by Megan Cooper, M.A.S., B.S. History
5 Pro Tips to Inspire as an Ecological Ambassador & Ally of the Planet
By Kate Miller-Wilson
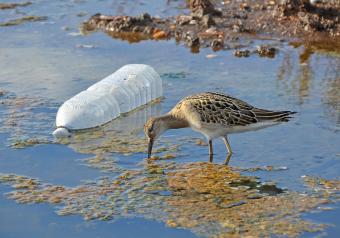
The Environmental and Health Consequences of Not Recycling Plastic
By Vijayalaxmi Kinhal, M.E.S., B.S.Ag
Effective Strategies for Reducing Pollution
By Vijayalaxmi Kinhal, M.E.S., B.S.Ag
Understanding the Varied Forms and Effects of Pollution
By Jared Skye
Top Slogans to Inspire Water Conservation Efforts
By Vijayalaxmi Kinhal, M.E.S., B.S.Ag
59 Catchy Go Green Slogans to Inspire Environmental Action
By Cheryl Cirelli
Understanding the Diverse Spectrum of Renewable Resources
By Vijayalaxmi Kinhal, M.E.S., B.S.Ag
Crafting Memorable Environmental Slogans
By Jared Skye
Widespread Impacts of Water Pollution on Health and Environment
By Jared Skye
Understanding Human Impact on Environmental Degradation
By Jared Skye
17 Laid-Back Ways to Upcycle Jeans & Denim
By Kate Miller-Wilson
15 Brilliant Repurposing Ideas for Old Junk
By Kate Miller-Wilson
12 Easy Ways to Start Your Zero-Waste Lifestyle
By Megan Cooper, M.A.S., B.S. History
6 Ultra-Useful Ways to Repurpose Entertainment Centers
By Kate Miller-Wilson
Uncork Creativity: 12 Things to Do With Empty Liquor Bottles
By Allison Freeman
10 Plastic Bottle Crafts That Are Way More Fun Than Recycling
By Megan Cooper, M.A.S., B.S. History
10 Things to Do With Old Tires to Keep Them Out of the Landfill
By Megan Cooper, M.A.S., B.S. History
8 Tips to Help You Embrace a Locavore Lifestyle
By Megan Cooper, M.A.S., B.S. History
What to Do With Old Computers (& How to Get Rid of Them Properly)
By Megan Cooper, M.A.S., B.S. History
15 Low-Effort Ways to Use Less Plastic in Your Everyday Life
By Megan Cooper, M.A.S., B.S. History
8 Things You Didn't Know You Could Recycle
By Megan Cooper, M.A.S., B.S. History
16 Smart Ways to Repurpose & Reuse Plastic Bags
By Megan Cooper, M.A.S., B.S. History
11 Hacks to Reduce Food Waste That’ll Make Your Trash Bins Lighter
By Megan Cooper, M.A.S., B.S. History
Common Greenwashing Examples & How to Avoid Being Duped
By Megan Cooper, M.A.S., B.S. History
10 Sustainable Living Ideas: Small Changes With Big Impact
By Megan Cooper, M.A.S., B.S. History
10 Simple Ways to Save Water Every Day at Home
By Heidi Butler
60+ Earth Day Slogans & Captions That'll Have You Going Green
By Heidi Butler
How to Dispose of Mineral Spirits the Safest Way
By Kate Miller-Wilson
DIY Easter Grass for an Eco-Friendly Bespoke Easter Basket
By Megan Cooper, M.A.S., B.S. History
6 Quick & Easy Ways to Dispose of an Old Couch
By Allison Freeman
How to Dispose of Paint Thinner the Right (& Wrong) Way
By Megan Cooper, M.A.S., B.S. History
Sustainability